
Blog about non-visual navigation, especially with tactile maps
Tuesday, May 6, 2014
Zeit-Artikel "Navi essen Orientierungssinn auf" (in German)
For those of you with a command of German please read this article of today. It highlights the problem of relying on electronical assistant systems (such as navigation systems) too much. The author Kathrin Passig wrote it with a sense of humour and it is a joy to read. From my own studies about tactile maps, I have added references to scientific articles that highlight the consequences of using navigation systems.

Friday, April 5, 2013
Schematisation in Visual and Tactile Maps
When construction tactile maps schematisation is one way to ensure that the map is easy to understand. In my talk about "What the Quest for Tactile Maps Can Teach Us about Making Interactive Maps" (download Extended Abstract & Presentation) I took the example of the London Underground to show the importance of schematisation for human conceptualisation of space.
In the beginning there was a veridical London Underground map in which geometry and topology were preserved, i.e. the maps is very similar to the geographic environment (from 1908).
The KickMap of the London Underground by Eddie Jabbour is another, more recent example. The development was motivated by the fact that the modern underground map has properties that make it hard to understand, for example, how above ground landmarks relate to undergound lines:
Another map that set out to enhance the current underground map is the London Tubemap by Mark Noad. As well as the KickMap, the TubeMap is not only topologically correct but preserves the geometry as much as possible to ensure that "the stations are geographically-accurate in relation to each other" (http://www.london-tubemap.com/about_the_map.php). On the downside there are more information in the map that the user needs to proces cognitively, for example, different slopes of lines and even freeform shapes of lines.

In my PhD I discuss what kind of schematisations could facilitate the comprehension of tactile orientation maps that are produced with a tactile printer. I tested different levels of abstraction that resulted in schematized maps (see below) and their effect on map understanding.


The thesis is to be published soon. Articles and presentation of the work can be found here.
In the beginning there was a veridical London Underground map in which geometry and topology were preserved, i.e. the maps is very similar to the geographic environment (from 1908).
 |
| Source: Wikipedia (http://en.wikipedia.org/wiki/File:Tube_map_1908-2.jpg) |
From 1931, Harry Beck started to rework the tube map realizing that any the topology of the network (e.g. connectivity, neighborhood relations) was important not so much its geometry (e.g. distances, angels). So he introduced the schematisation of the intersections to be quadlinear (i.e. all angles are abstracted to 90° and 45°) and the conncection between intersection to be straight (with some roundness at corners):
 |
| Source: Wikipedia (http://en.wikipedia.org/wiki/File:TubeMapZ1_TFL.png) |
There were several suggestions for improving the Beck map (and its successors) as with the schematic map it was hard to estimate distances or direction between stations. Recently, the idea of maps that are less schematic but that make it easier to match the geographic reality to foster comprehension by the users has gained some attention. Relaxing the constraints of straight lines only and multiple of 45° angles only can produce more veridical (and less schematic) maps like this one by James D. Forrester:
 |
| Source: Wikipedia (http://en.wikipedia.org/wiki/File:London_Underground_Zone_1.svg) |
The KickMap of the London Underground by Eddie Jabbour is another, more recent example. The development was motivated by the fact that the modern underground map has properties that make it hard to understand, for example, how above ground landmarks relate to undergound lines:
"Contributing to the confusion is the trend of modern Tube Map designs to be even more abstracted than Beck's original, resulting in a severe disconnection from the above-ground geography of London. This unfortunate drift is apparent by looking at London's geographic anchor, the River Thames, and its relation to stations as drawn by Beck, and comparing it to the present Tube map's Thames rendering and its relation to stations. Indeed, a few years back the tendency toward abstraction culminated in the Thames being removed entirely from the official Tube Map." (KickMap of the London Underground)See this O'Reilly Radar post to understand the inspirations, the constraints, the trade offs, the multiple iterations that went into the final design.
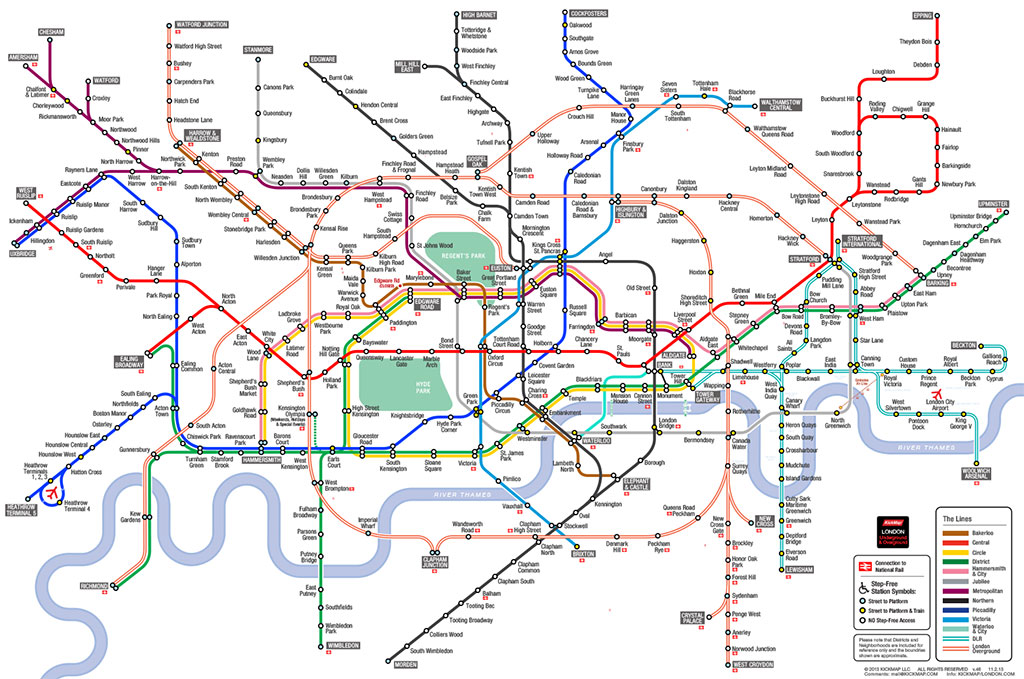 |
| Source: KickMap London (http://www.kickmap.com/London/images/KMAP_LONDON_SMALL_lg.jpg) |
Another map that set out to enhance the current underground map is the London Tubemap by Mark Noad. As well as the KickMap, the TubeMap is not only topologically correct but preserves the geometry as much as possible to ensure that "the stations are geographically-accurate in relation to each other" (http://www.london-tubemap.com/about_the_map.php). On the downside there are more information in the map that the user needs to proces cognitively, for example, different slopes of lines and even freeform shapes of lines.

In my PhD I discuss what kind of schematisations could facilitate the comprehension of tactile orientation maps that are produced with a tactile printer. I tested different levels of abstraction that resulted in schematized maps (see below) and their effect on map understanding.


The thesis is to be published soon. Articles and presentation of the work can be found here.
Wednesday, April 3, 2013
Tactile Displays go mainstream?!
The adaptionof current research into the realm of consumer products is a clear sign for me that tactile and haptic technology is the next big thing in human-computer interaction. See the following articles (to be extended):
Tuesday, February 19, 2013
Presentations about "Maps for Handicapped People" @ ICC 2001
D.R.F. Taylor (Canada)
|
| Maps for the Blind and Visually Handicapped |
Izabella Krauze-Tomczyk ,Jolanta Korycka-Skorupa (Poland)
|
| Tactile Campus Mapping: Evaluating Designs and Production Technologies |
Chris Perkins (United Kingdom)
|
| How to Make Tactile Maps Discriminable for Touch? |
Yvonne Eriksson (Sweden)
|
A F Tatham (UK)
|
Cecília Maria OKA ,Carla Cristina Reinaldo de SENA (Brazil)
|
Eva Siekierska, Richard Labelle, Linda O’Neil (Canada)
Kostas Papadopoulos, Chryssoula Boutoura, Evangelos Livieratos (Greece)
|
Schematisation of routes in another PhD project
A blog I reguarly read for the pure joy of cartographic material is Beagraphy, written by Beate Weninger. She is a doctoral student of geography from Graz who is doing her PhD about the usability of noise maps in Hamburg. We sometimes meet at the UX roundtable where she presented her former project about 'accoustically enhanced maps'.
Beate's latest post pointed my to the project 'Literaturatlas', co-headed by Lorenz Hurni of ETH Zurich, whom I visited five years ago to speak with him about his work on terrain models, especially reliefs for the blind. The Literaturatlas is a cartographic visualisation of places and routes that are mentioned in literature (see the motivating scenario).
Amoung other visualisation techniques, schematised routes are used to clarify the arbitrariness of routes (in German) when only some (vague) waypoints are mentioned in some text. The concept of schematisation is used here in a similar way as in my dissertation albeit applied to routes not to whole street networks.

This is the first time that I see the term schematisation used outside of my research group to describe the process of map abstraction. Although it used here to describe a visualisation technique (in cartographic terms, that is generalisation) it is similar to the drawing people produce when externalsing the cognitive schematisation that happens in their minds when listening to route descriptions or reading tactile maps with their fingers.
Beate's latest post pointed my to the project 'Literaturatlas', co-headed by Lorenz Hurni of ETH Zurich, whom I visited five years ago to speak with him about his work on terrain models, especially reliefs for the blind. The Literaturatlas is a cartographic visualisation of places and routes that are mentioned in literature (see the motivating scenario).
Amoung other visualisation techniques, schematised routes are used to clarify the arbitrariness of routes (in German) when only some (vague) waypoints are mentioned in some text. The concept of schematisation is used here in a similar way as in my dissertation albeit applied to routes not to whole street networks.
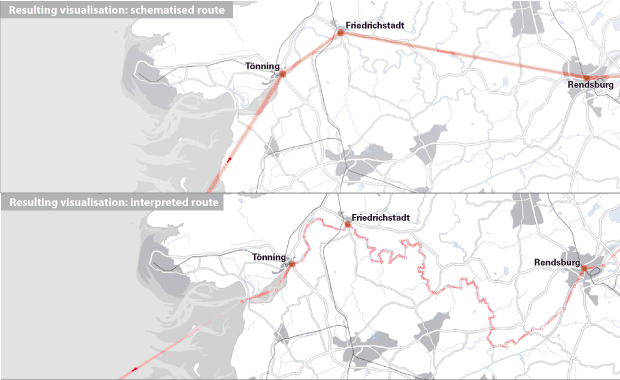
This is the first time that I see the term schematisation used outside of my research group to describe the process of map abstraction. Although it used here to describe a visualisation technique (in cartographic terms, that is generalisation) it is similar to the drawing people produce when externalsing the cognitive schematisation that happens in their minds when listening to route descriptions or reading tactile maps with their fingers.
Wednesday, February 6, 2013
heise.de berichtet über Navigation für Blinde
heise.de, eins der starken (und m.M. guten) online-Leitmedien, hat heute über die Navigation für Blinde berichtet, ein Anlass für mich, dies auch hier kundzutun. Ich freue mich besonders über die Berichterstattung zu diesen sonst eher als Randthemen eingestuften Arbeiten. Da kann man sicher sein, dass es auch Aufmerksamkeit bekommt, wie ich an zwei unabhängig bei mir eingegangen Mails sehen konnte, die mich auf den Artikel aufmerksam machten.
Ergänzend dazu noch ein paar Links zu einer Technologie, die den Ansatz der Sinnessubstitution verfolgt, allerdings nicht unbedingt auf Navigation ausgerichtet:
Ergänzend dazu noch ein paar Links zu einer Technologie, die den Ansatz der Sinnessubstitution verfolgt, allerdings nicht unbedingt auf Navigation ausgerichtet:
- The vOICe - Seeing with Sound (Peter B.L. Meijer)
- Seeing with your ears (Michael Proulx, Bath University)
- Mit den Ohren sehen - die Hörbrille (ARD Sendung)
Thursday, September 27, 2012
HCI & IxD Conferences 2013
Conferences that are eligable for presenting some of my PhD work on the computer-centric printing of usable tactile orientation maps:
- March, 19-22: INTERNATIONAL CONFERENCE ON INTELLIGENT USER INTERFACES (Santa Monica, USA), Abstracts due Oct 15, papers Oct 22, 2012
- April, 15-18: Ergonomics and Human Factors (Cambridge, UK), Papers due Oct 1, 2012
- April, 27 - May, 02 : CHI 2013 (Paris, France),Oct 5, 2012
- May : HCI 2013 - People and Computers (UK)
- July 1-3 : SOUTH-CHI 2013 (Maribor, Slovenien), papers due Nov 1, 2012
- July, 21-26 : HCI International 2013 (Las Vegas, USA), abstracts due Oct 12, 2012 papers due Feb 1, 2013
- July, 22-27: ICCHP Summer University (Karlsruhe, Germany)
- July, 31 - August, 03 : CogSci 2013 (Berlin, Germany)
- August: International Workshop on Haptic and Audio Interaction Design 2013 (Sweden?), Papers due April (?) 2013
- August, 25-30 : International Cartographic Conference 2013 (Dresden), papers due Nov 1, 2012
- September, 2-6 : INTERACT 2013 (CapeTown, South Africa), 8 January 2013 (abstracts), 15 January 2013 (full papers).
- September: State of the Map 2013
Monday, August 13, 2012
Touch Effects by Reverse Electrovibrations
As follow up to my last post on the development of tactile interfaces and the one before about different approaches to tactile interfaces, Walt Disney researchers present a methods to induce touch effects that works without bulky extra hardware like gloves or force-feedback device but with a thin covering on the display: Feel the touch through electrovibrations. Unfortunately no directional forces can be transmitted as far as I can learn from the description (see below). Insofar the technology is of limited use for guiding the fingers over the surface.
"REVEL is a new wearable tactile technology that modifies the user’s tactile perception of the physical world. Current tactile technologies enhance objects and devices with various actuators to create rich tactile sensations, limiting the experience to the interaction with instrumented devices. In contrast, REVEL can add artificial tactile sensations to almost any surface or object, with very little if any instrumentation of the environment. As a result, REVEL can provide dynamic tactile sensations on touch screens as well as everyday objects and surfaces in the environment, such as furniture, walls, wooden and plastic objects, and even human skin.
REVEL is based on Reverse Electrovibration. It injects a weak electrical signal into anywhere on the user's body, creating an oscillating electrical field around the user’s skin. When sliding his or her fingers on a surface of the object, the user perceives highly distinctive tactile textures that augment the physical object. Varying the properties of the signal, such as the shape, amplitude and frequency, can provide a wide range of tactile sensations." (from the video clip page: http://www.youtube.com/watch?v=L7DGq8SddEQ )
"REVEL is a new wearable tactile technology that modifies the user’s tactile perception of the physical world. Current tactile technologies enhance objects and devices with various actuators to create rich tactile sensations, limiting the experience to the interaction with instrumented devices. In contrast, REVEL can add artificial tactile sensations to almost any surface or object, with very little if any instrumentation of the environment. As a result, REVEL can provide dynamic tactile sensations on touch screens as well as everyday objects and surfaces in the environment, such as furniture, walls, wooden and plastic objects, and even human skin.
REVEL is based on Reverse Electrovibration. It injects a weak electrical signal into anywhere on the user's body, creating an oscillating electrical field around the user’s skin. When sliding his or her fingers on a surface of the object, the user perceives highly distinctive tactile textures that augment the physical object. Varying the properties of the signal, such as the shape, amplitude and frequency, can provide a wide range of tactile sensations." (from the video clip page: http://www.youtube.com/watch?v=L7DGq8SddEQ )
Friday, June 15, 2012
iPhone App supporting blind people's navigation: Ariadna GPS
My colleaque Paolo Fogliaroni pointed me to Ariadne GPS. It seems to be of interest for the scenario I have chosen for my PhD work: Survey knowledge
acquisition with (tactile) maps, most likely for blind people.
"Ariadne GPS is more than a simple gps app. Besides offering you
the possibility to know your position and to get information about the
street, the number, etc. it also lets you explore the map of what's
around you.
What do we mean by saying "explore"? You'll deal with a talking map. If you have VoiceOver activated on your device, you will be able to know the street names and numbers that are around you by touching them. [...] You can also explore a different region than the one around you by telling the app the street and the city."
What do we mean by saying "explore"? You'll deal with a talking map. If you have VoiceOver activated on your device, you will be able to know the street names and numbers that are around you by touching them. [...] You can also explore a different region than the one around you by telling the app the street and the city."
 |
| Screenshot from the app on an iPad - get it here |
The capability I am interested in the most is that this app lets you
know of what's around you with the button "Explore Region". That capability could be compared to a dynamically self-updating You-are-Here map with the user being always in the middle of the map.
A big drawback of any mobile phone based map: it's small and can only cover a very limited part of the environment. This situation is slightly better when using devices with a bigger screen, like the iPad. Another drawback is that the premium channel to convey any meaning to the blind user is voice. Everythings needs to be memorized verbally. Several videos show how that would work, they are also available as audio podcast.
The advent of tactile displays/interfaces could overcome the spatial knowledge acquisition by speech only. But then there is the question how to abstract and optimize the high details visual maps or GIS data to the low detail tactile interfaces. Then my PhD work might come into play.
Tuesday, June 12, 2012
Development in Tactile interfaces
Some (not so) recent developments:
- Visual art accessible for the blind through "High-quality tactile paintings" (PDF)
- Touchscreens that sends tactile information to the hand through the display (video).
Saturday, May 19, 2012
Writing a thesis on multiple computers
While researching about the principles of constructing tactile orientation maps (semi)automatically I have built my own data storage infrastructure that synchronizes my files and data to multiple computers. The background is that I work from different sites with different computers, some of which are always online, some of them at least partially offline (for example when I ride the train).
First, I installed Zotero, the reference gathering and management tool, as extension to Firefox. The reference data and some files attached to references are stored locally on the computer such that one can work offline. Originally intended for installation on a single computer Zotero can be tweaked to work on multiple computers (each one has to be assigned a unique ID via the Firefox configuration), such that all synchronize with the same reference collection and the same file storage. I originally used the GMX MediaCenter as WebDAV backend for file storage which worked fine until recently. In April 2012 there was some unannouced change in the GMX policies that restrict folder sizes to 1000 files (see this help page). As Zotero stores all file attachments non-hierachically in one folder and as each attachment has an additional property file this restriction means that you can only store 500 attachments. My collection of references has well above 1000 items, thus GMX MediaCenter does not work for me anymore. I am in search of a replacement offering at least 3GB of storage over WebDAV. I tried Microsoft Skydrive (7GB but no WebDAV) and T-Online Mediencenter (25GB but no WebDAV) as storage provider and SME Storage as WebDAV interface to these providers and my own FTP server. But I haven't found a working solution yet even if there are great website to compare cloud storage solutions (often other solutions have the 1000 files limit as well or a transfer limit of less than 2GB). If someone knows one for not more than 50Euros/year, please point me to that solution!
Working on my thesis, I found that the cloud storage services Dropbox and Wuala are pretty useful when you work at different places with different computers. I particularly like Wuala. It is a European service, offers real client-side encryption and a non-hierarchical embedding of sync-folders into the local file system. Even if encrypted in the cloud most services suffer from some security issues as the recent report "On the Security of Cloud Storage Services" (in German) by the Fraunhofer SIT turned up. I would like to have my data on my own server, but this will be done only after I have finished my thesis. Then I will setup some own WebDAV server that can hold my attachments of my Zotero library, all my photos etc. that are now distributed over different cloud services.
Having worked on a heterogenous infrastructure in the past including different operation systems (Windows, MacOS) and different word processors (Word, OpenOffice, LaTeX), I needed some tool to convert from DOC and RTF files including tables and figures to TeX files. This page about free and commercial coverters on TUG.org helped my a lot.
First, I installed Zotero, the reference gathering and management tool, as extension to Firefox. The reference data and some files attached to references are stored locally on the computer such that one can work offline. Originally intended for installation on a single computer Zotero can be tweaked to work on multiple computers (each one has to be assigned a unique ID via the Firefox configuration), such that all synchronize with the same reference collection and the same file storage. I originally used the GMX MediaCenter as WebDAV backend for file storage which worked fine until recently. In April 2012 there was some unannouced change in the GMX policies that restrict folder sizes to 1000 files (see this help page). As Zotero stores all file attachments non-hierachically in one folder and as each attachment has an additional property file this restriction means that you can only store 500 attachments. My collection of references has well above 1000 items, thus GMX MediaCenter does not work for me anymore. I am in search of a replacement offering at least 3GB of storage over WebDAV. I tried Microsoft Skydrive (7GB but no WebDAV) and T-Online Mediencenter (25GB but no WebDAV) as storage provider and SME Storage as WebDAV interface to these providers and my own FTP server. But I haven't found a working solution yet even if there are great website to compare cloud storage solutions (often other solutions have the 1000 files limit as well or a transfer limit of less than 2GB). If someone knows one for not more than 50Euros/year, please point me to that solution!
Working on my thesis, I found that the cloud storage services Dropbox and Wuala are pretty useful when you work at different places with different computers. I particularly like Wuala. It is a European service, offers real client-side encryption and a non-hierarchical embedding of sync-folders into the local file system. Even if encrypted in the cloud most services suffer from some security issues as the recent report "On the Security of Cloud Storage Services" (in German) by the Fraunhofer SIT turned up. I would like to have my data on my own server, but this will be done only after I have finished my thesis. Then I will setup some own WebDAV server that can hold my attachments of my Zotero library, all my photos etc. that are now distributed over different cloud services.
Having worked on a heterogenous infrastructure in the past including different operation systems (Windows, MacOS) and different word processors (Word, OpenOffice, LaTeX), I needed some tool to convert from DOC and RTF files including tables and figures to TeX files. This page about free and commercial coverters on TUG.org helped my a lot.
Thursday, May 17, 2012
Ancient tactile maps to ease navigation of coast lines
In a comment to my business blog, mprove pointed me to the cover of Bill Buxton's book 'Sketching User Experiences'. It shows a close-up of some physical artefact that is not discernable at first glance. On page 36 you can find the explanation what it is: it's a map made of wood showing some coastal region which was used by the Inuit people to navigate along the shores of Canada and Greenland (see the picture below)

I learned about these 'ancient' tactile maps from a blog post from 2008 in and a blog post from 2010. It's fascinating, so have a look at these post and the comments to it as they hold a lot of interesting detail!
For me, these artefacts clearly shows that tactile maps are not only for the blind, but that they can help visually able persons as well. The property that makes such maps useful is the representational correspondence between the structure of the representation of the geographic world (i.e. the map) and the structure of the geographic environment. Additionally the representational format of the map is the same as the format of the represented structure: it's spatial. For non-blind persons, the match between representation and the represented to find correspondence is eased even more as both, artefact and environment, are accessible visually.
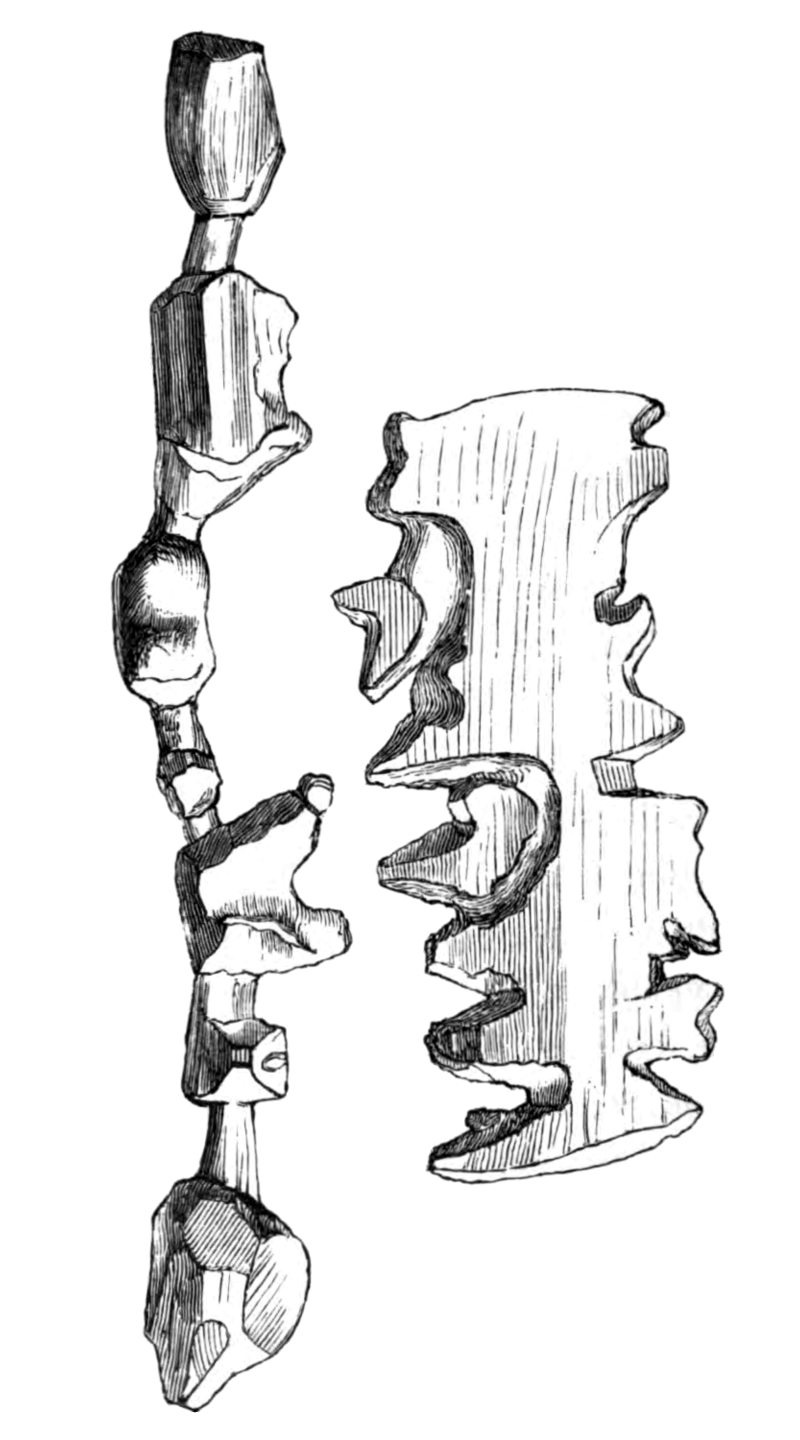
von Gustav Holm, Vilhelm Garde [Public domain] via Wikimedia Commons
I learned about these 'ancient' tactile maps from a blog post from 2008 in and a blog post from 2010. It's fascinating, so have a look at these post and the comments to it as they hold a lot of interesting detail!
For me, these artefacts clearly shows that tactile maps are not only for the blind, but that they can help visually able persons as well. The property that makes such maps useful is the representational correspondence between the structure of the representation of the geographic world (i.e. the map) and the structure of the geographic environment. Additionally the representational format of the map is the same as the format of the represented structure: it's spatial. For non-blind persons, the match between representation and the represented to find correspondence is eased even more as both, artefact and environment, are accessible visually.
Saturday, May 5, 2012
Different Approaches to Computer-controlled Tactile Displays
Helen Knight writing for New Scientist, Magazine issue 2862, reports about a new navigation device for blind people in the article "Robot Sensing and Smartphones to Help Blind Navigate". It was presented in the talk "Intelligent Glasses? Visuo-tactile Assistance for Visually Impaired Interaction" at the MIT: "Edwige Pissaloux and colleagues at Pierre and Marie Curie
University's Institute of Intelligent Systems and Robotics (ISIR) have
developed technology that could eventually let blind users navigate
their surroundings without assistance. The system features glasses
outfitted with cameras and sensors like those employed in robot
exploration, and it generates a three-dimensional map of the user's
environment and their position in it, which is continuously updated and
displayed on a handheld electronic Braille device. The system produces
nearly 10 maps each second, which are transmitted to the Braille device
and displayed as a dynamic tactile map. Pissaloux says the Braille
map's update speed is sufficient for a visually impaired wearer to
navigate an area at walking speed." read more
As much as I welcome the development of new technology in the mobility area for visually disabled I really wonder how low-tech these gadgets seem to be in terms of cognitive consideration put into the development. This particular work is developed in the robotics domain and uses advances computer vision techniques to determine what to display on a small Braille pad - so one might understand that it is technology focussed. From that aspect this project is interesting as it employs shape memory alloy to bring the tactual entities into being (I could not varify if the result is a continous surface or a rather discrete surface). But given that the Braille pad should be used by blind people, their specific cognitive abilities should be under consideration when developing assistive technology.
In this regard other approaches fall short as well: In the BMWi funded project Hyperbraille a pin-matrix display has been developed that works as a composition of hundrets of electro-mechanical piezo benders which raise the pins to form one sampled, discrete image. Some years ago, there was a NSF funded project at John Hopkins University (2007-2009) advancing a dynamic electronic surface (on a polymer basis as well), but the development seems to have ceased. The EU-project NOMS (2010-2013) works on electroactive polymers hydraulics to promote materials & new production technologies for the interaction with a discrete surface (see articles in Wired and Scientific America). Other projects care about navigation support for the blind, but are not primarily focussed on technology: ENABLED (2004-2007), HAPTIMAP (2008-2012) and Nav4Blind - all of them are interrelated. Other technologies like laser lithography might become interesting once established for home use and the production of appropriate sized objects.
Displaying an image as tactile version on a Braille pad does not necessarily mean that the users understand that representation of the world. What catched my attention in this regard is the design decission to generate a 3d representation on the tactile pad. What for? Unfortunately nothing is said about this aspect in the article and there is no other material available about the project. Most blind people I spoke to were not interested in the heights of buildings. In some cases the inclination of the pavement might be interesting to orientate oneself. But I doubt that any tactile display listed above is able to represent this, let alone the ability to read thus information of these displays. In general, the abstractions must be understandable, i.e. matching the cognitive abilities and the specialities of tactile processing. That is what my PhD project is aiming for: cognitively-adequate tactile orientation maps.
The initially mentioned ISIR at the Université Pierre et Marie Curie is consortium member in the EU-project Assistive Technology Rapid Integration & Construction Set (AsTeRICS) as well. It hosts a group on interaction and describes itself as being involved in cognitive science. Unfortunately this expertise seems to be underrepresented in the current work. ISIR might have the opportunity to push cognitive consideration in the project the institute is involved in. But the same seems to be true for most EU-projects in the 7th framework: they are technology driven and put cognitive consideration as an optional add-on at the end of the development cycle. I think we can learn from Human-Computer-Interaction here: Until approx. the 1980th most development was technology driven (then the success of the Mac brought good design and usability to the attention of people). From the 1990th usability was considered a major factor of the customers' acceptance and 15 years later the even wider concept of user experience had settled in the minds of designers, developers and marketeers. The focus has shifted from technology to human-centred functionality to personality. In the domain of tactile displays we are now in the phase of technology-focussed development. Some people will realize that there must be a shift towards human-centred and cognitive aspects as people won't accept (and will not buy) technology without these considerations taken into account.
Note: see also my recent post on Developments in Tactile Interfaces
As much as I welcome the development of new technology in the mobility area for visually disabled I really wonder how low-tech these gadgets seem to be in terms of cognitive consideration put into the development. This particular work is developed in the robotics domain and uses advances computer vision techniques to determine what to display on a small Braille pad - so one might understand that it is technology focussed. From that aspect this project is interesting as it employs shape memory alloy to bring the tactual entities into being (I could not varify if the result is a continous surface or a rather discrete surface). But given that the Braille pad should be used by blind people, their specific cognitive abilities should be under consideration when developing assistive technology.
In this regard other approaches fall short as well: In the BMWi funded project Hyperbraille a pin-matrix display has been developed that works as a composition of hundrets of electro-mechanical piezo benders which raise the pins to form one sampled, discrete image. Some years ago, there was a NSF funded project at John Hopkins University (2007-2009) advancing a dynamic electronic surface (on a polymer basis as well), but the development seems to have ceased. The EU-project NOMS (2010-2013) works on electroactive polymers hydraulics to promote materials & new production technologies for the interaction with a discrete surface (see articles in Wired and Scientific America). Other projects care about navigation support for the blind, but are not primarily focussed on technology: ENABLED (2004-2007), HAPTIMAP (2008-2012) and Nav4Blind - all of them are interrelated. Other technologies like laser lithography might become interesting once established for home use and the production of appropriate sized objects.
Displaying an image as tactile version on a Braille pad does not necessarily mean that the users understand that representation of the world. What catched my attention in this regard is the design decission to generate a 3d representation on the tactile pad. What for? Unfortunately nothing is said about this aspect in the article and there is no other material available about the project. Most blind people I spoke to were not interested in the heights of buildings. In some cases the inclination of the pavement might be interesting to orientate oneself. But I doubt that any tactile display listed above is able to represent this, let alone the ability to read thus information of these displays. In general, the abstractions must be understandable, i.e. matching the cognitive abilities and the specialities of tactile processing. That is what my PhD project is aiming for: cognitively-adequate tactile orientation maps.
The initially mentioned ISIR at the Université Pierre et Marie Curie is consortium member in the EU-project Assistive Technology Rapid Integration & Construction Set (AsTeRICS) as well. It hosts a group on interaction and describes itself as being involved in cognitive science. Unfortunately this expertise seems to be underrepresented in the current work. ISIR might have the opportunity to push cognitive consideration in the project the institute is involved in. But the same seems to be true for most EU-projects in the 7th framework: they are technology driven and put cognitive consideration as an optional add-on at the end of the development cycle. I think we can learn from Human-Computer-Interaction here: Until approx. the 1980th most development was technology driven (then the success of the Mac brought good design and usability to the attention of people). From the 1990th usability was considered a major factor of the customers' acceptance and 15 years later the even wider concept of user experience had settled in the minds of designers, developers and marketeers. The focus has shifted from technology to human-centred functionality to personality. In the domain of tactile displays we are now in the phase of technology-focussed development. Some people will realize that there must be a shift towards human-centred and cognitive aspects as people won't accept (and will not buy) technology without these considerations taken into account.
Note: see also my recent post on Developments in Tactile Interfaces
Tuesday, April 17, 2012
Call for Papers for SKALID 2012

Tactile Display coupled with Tactile Sensor
As Inside-Handy reports, there is an interesting development by NEC and the Tokioter Institute of Technology: a tactile display is uses coupled with sensory abilities which results in a complete tactile interaction device. In contrast to the original article, I doubt that this device provides any kind of force-feedback abilities. Real force-feedback would demand for any mechanism that can excert a force to the finger(s) or at least the sensation of a force to the mechanoreceptors in the skin. As far as I can see, there is no such think it this prototype. But watch yourself:
Friday, April 13, 2012
Links to work on Spatial Cognition, HCI & Tactile Media
Spatial Cognition
- Spatial Intelligence and Learning Center (SILC)
- "Spatial Cognition" trans-regional research group at Bremen University
- "Spatial Cognition and Wayfinding" lab at Bournemouth University
- Center for Spatial Studies, University of California
- "Spatial Thinking" lab at the University of California
Human Factors in Spatial Cognition
- "Human Factors in GIScience" Lab, Penn State University
- Computer Science and Media, Bauhaus Universität Weimar
Tactile Media/Maps
- Arbeitsgruppe Studium für Blinde und Sehbehinderte & Professur HCI, Universität Dresden
- Computer-controlled, refreshable tactile displays:
- with piezo-electric, descrete dots: HyperBraille (demo video)
- with dielectric elastomer, decrete dots (paper1, paper2, paper3)
- HaptiMap EU project
- Open Street Map for the blind project (published HaptoRenderer) - some output printed with a graphical embosser (pictures only)
Commercial Projects
More links at The Blind Readers' PageTuesday, January 17, 2012
Motivation of scientific research
An article in the online version of the newspaper FAZ these days brought me to think about my own motivation of doing scientific research. I think it's pure curiosity - nothing more, nothing less. But in my professional environment I see at least some doctoral students that strive for relations with more senior researchers/professors/etc. I ask myself: what are their motives? Maybe, to have a better start after graduation. Maybe, because they generally like older people and want to surround themselves with they people they like. For me, it's startling because I cannot resist the feeling that the relation these people build is more of strategic nature, not real. Fortunately I see many other doctoral students whose first motivation is curiosity. And I hope that science as subject will continue to be grounded in curiosity, not in building up pure reputation networks.
Thursday, September 29, 2011
The BSVH, Heiko Kunert and the blog Blind-PR
In Hamburg there is a quite vibrant scene of blind and visually-impaired people, most prominently gathered in the BSVH, the society of blind and visually-impaired people Hamburg.The activities of the BSVH are targeted at community building through joint activities, public awareness through the distribution of information, and policy advocacy through giving advice and comments to policy makers. The society gathers relevant news, publishes the newsletter "Augenblick Mail" and its own press releases and twitter feed, has an event calender and provides information about sight-related illnesses and where to get help in Hamburg. Once a month there is the BSVH-Treff, a two-hour talk session aired by the Hamburg local radio station, that is available as podcast as well.
Heiko Kunert, the current public relation officer and designated manager general from 2012 on, is the most visible beacon of the active community members. He runs the blog Blind-PR where he comments on current developments of assistive technology, public policies and a diversity of issues adjacent to the needs and rights of people with special needs. Heiko supported different media in reporting about aspects of living with visual impairements, for example, in "DIGIsellschaft" for ZDF Elektrischer Reporter or in "Mein Leben als Blinder" for Pro7 Galileo.
Heiko Kunert, the current public relation officer and designated manager general from 2012 on, is the most visible beacon of the active community members. He runs the blog Blind-PR where he comments on current developments of assistive technology, public policies and a diversity of issues adjacent to the needs and rights of people with special needs. Heiko supported different media in reporting about aspects of living with visual impairements, for example, in "DIGIsellschaft" for ZDF Elektrischer Reporter or in "Mein Leben als Blinder" for Pro7 Galileo.
Thursday, September 8, 2011
Ken Forbus talked about "Sketching our way to human-level AI"
On Tuesday, Ken Forbus from the Northwestern University gave a talk "Sketching our way to human-level AI" as part of his 3-day visit to the SFB/TR 8 Spatial Cognition research group at the University of Bremen:

For me, the talk was highly interesting as it opened up a perspective how to analyse sketches of maps in a conceptual way. Other pictures are available here
In a personal conversation one day later, Ken took the time and discussed with me how I could use CogSketch in my research. This approach allows to compare sketches and helps to segment them into the basic conceptually entities. The algorithms and knowledge base behind CogSketch allow to compute a similarity value on the ground of spatial properties, for example, the directional relations of entities, their neighbourhood, the containment etc. CogSketch is really amazing and I will definitely give a try!
Thank you Ken for your time and your advice and please continue with your collaborators to provide such great tools like CogSketch!
"This talk will summarize two large-scale efforts at Northwestern: (1) CogSketch, an open-domain sketch understanding system. Our goal with CogSketch is to make it a useful research instrument for cognitive scientists (including AI researchers) and as a platform for sketch-based educational software. (2) Companion cognitive systems, a cognitive architecture which makes analogical processing central. Our goal with Companions is to create the first software social organisms, a step towards human-level artificial intelligence. I'll focus on aspects of these efforts that might be particularly interesting from the perspective of potential collaborations: knowledge capture games to explore the semantics of spatial language, modeling 3D reasoning of engineers, learning by reading, and apprenticeship learning in a strategy game."

For me, the talk was highly interesting as it opened up a perspective how to analyse sketches of maps in a conceptual way. Other pictures are available here
In a personal conversation one day later, Ken took the time and discussed with me how I could use CogSketch in my research. This approach allows to compare sketches and helps to segment them into the basic conceptually entities. The algorithms and knowledge base behind CogSketch allow to compute a similarity value on the ground of spatial properties, for example, the directional relations of entities, their neighbourhood, the containment etc. CogSketch is really amazing and I will definitely give a try!
Thank you Ken for your time and your advice and please continue with your collaborators to provide such great tools like CogSketch!
Conferences on Tactile Maps or Cognitive Issues of Navigation
Recently, the 1st European State of the Map Conference of the OpenStreetMap project took place in Vienna, Austria. Participants from various countries were present and listened to a bunch of interesting talks. In the context of my research, the talk by Annette Thurow on OSM for blind users was particularly insightful. How to make customized maps from OSM data with Maperitive was demonstrated as well. All recordings of the presentations and conference proceedings (PDF) are available.
Upcoming conferences and possibly relevant presentations:
Upcoming conferences and possibly relevant presentations:
- Braille21 in Leipzig:
- T2: Banning a Chimera with the Hyperbraille Display
Prof. Gerhard Weber - 10th COSIT in Belfast (US):
- Poster: Towards a theory of spatial assistance from a phenomenological perspective: Technical and social factors for blind navigation
Kirsten Jacobson, Nicholas A. Giudice, and Reinhard Moratz - Poster: A Conceptual framework for comparing navigation across different domains: Lessons from blind navigation
Julio C. Mateo - Paper: Towards Cognitively Plausible Spatial Representations for Sketch Map Alignment
Malumbo Chipofya, Jia Wang, Angela Schwering - Paper: The Effect of Activity on Relevance and Granularity for Navigation
Stephen Hirtle, Sabine Timpf and Thora Tenbrink
Subscribe to:
Posts (Atom)